
Blog
Python Scatter Plots

Python Scatter Plots
Let’s learn about Python Scatter Plots. A Scatter Chart is a graph of plotted points on the two axes( x-axis and y-axis) that show the relationship between two data sets.
Scatter Plots
We can create scatter charts using the Python Pyplot library. The functions that can be used are as follows:
- plot( ) function
- scatter( ) function

plot() function
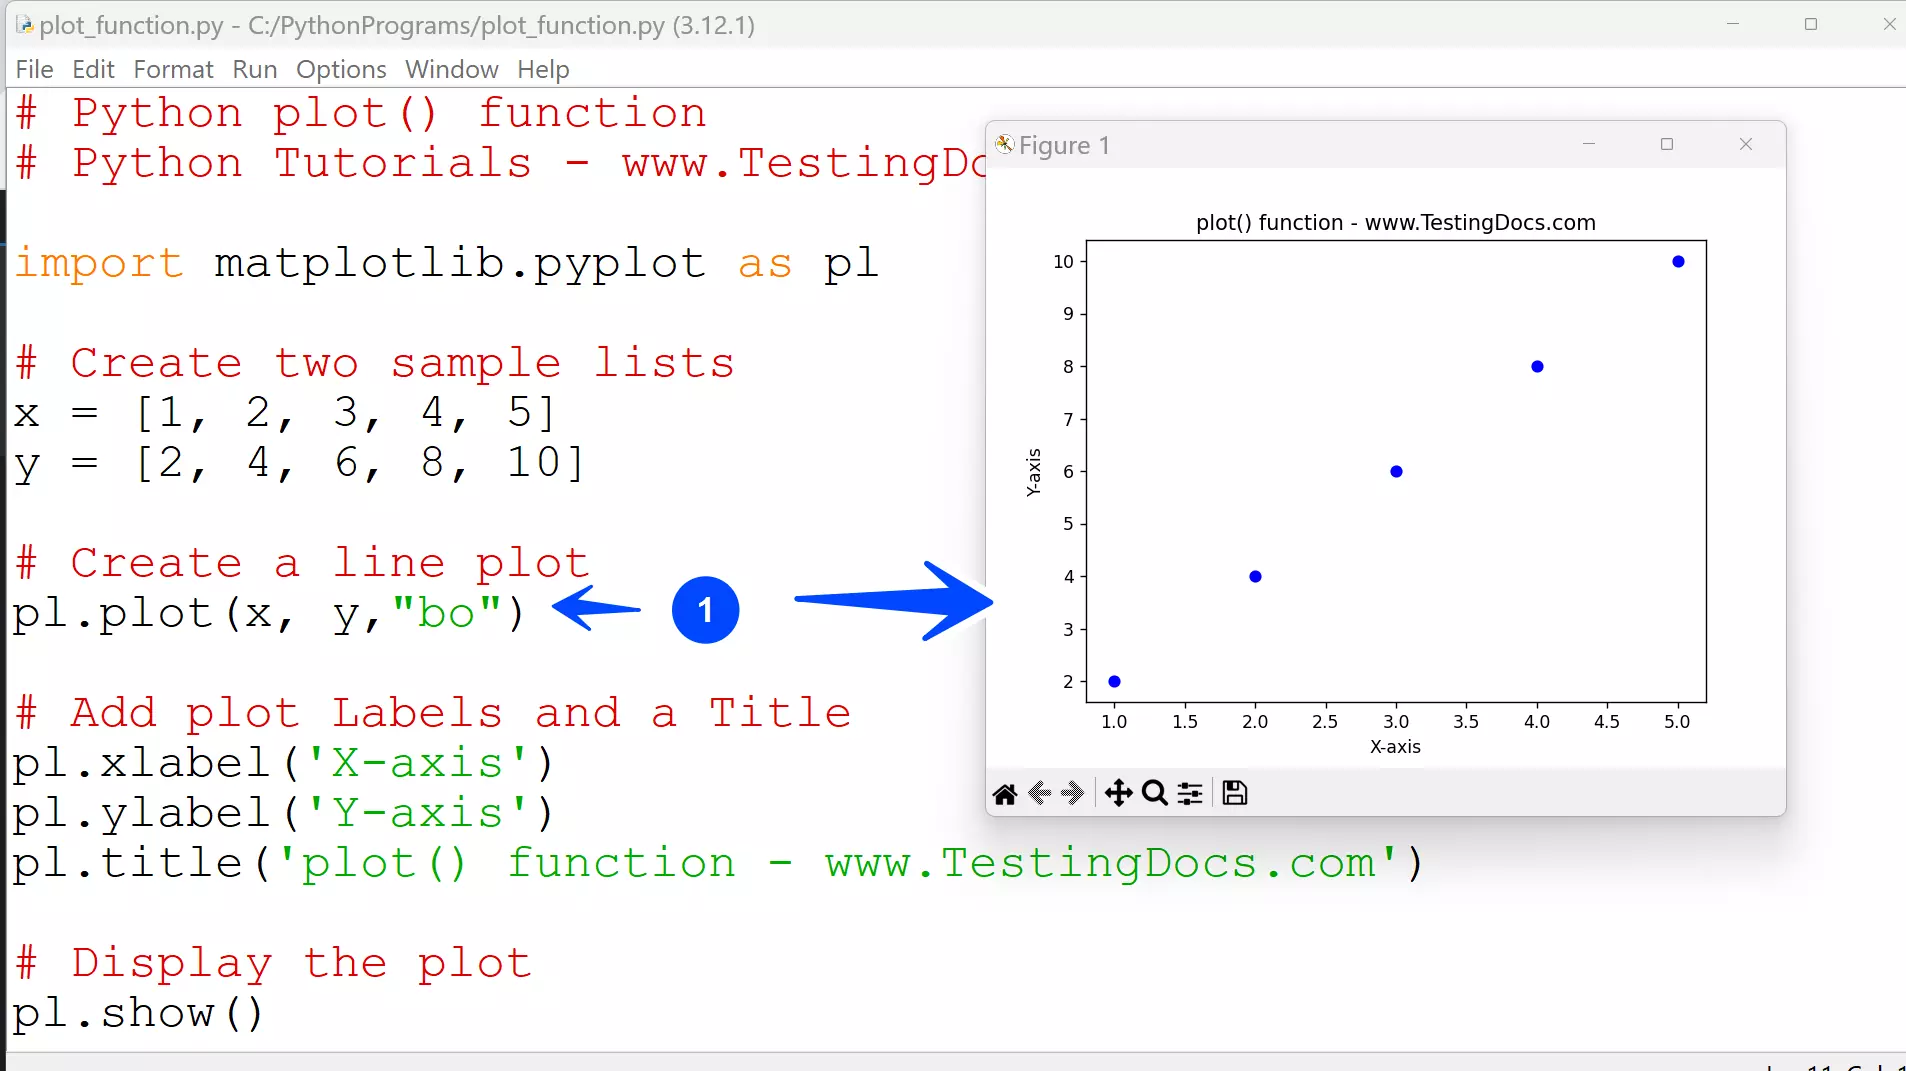
When the marker is specified ( for example, “bo”) without the linestyle argument in the plot() function, the resulting plot resembles a scatter chart as only the data points are plotted.
# Python plot() function simulate scatter chart
# Python Tutorials – www.TestingDocs.com
import matplotlib.pyplot as pl
# Create two sample lists
x = [1, 2, 3, 4, 5]
y = [2, 4, 6, 8, 10]
# Create a line plot
pl.plot(x, y,”bo”)
# Add plot Labels and a Title
pl.xlabel(‘X-axis’)
pl.ylabel(‘Y-axis’)
pl.title(‘plot() function – www.TestingDocs.com’)
# Display the plot
pl.show()
scatter() function
The scatter() function can be used as:
matplotlib.pyplot.scatter(<array1>, <array2>)
or
<pyplot aliasname>.scatter(<array1>, <array2>)
Example
# Python scatter() function
# Python Tutorials – www.TestingDocs.com
import numpy as npy
import matplotlib.pyplot as pl
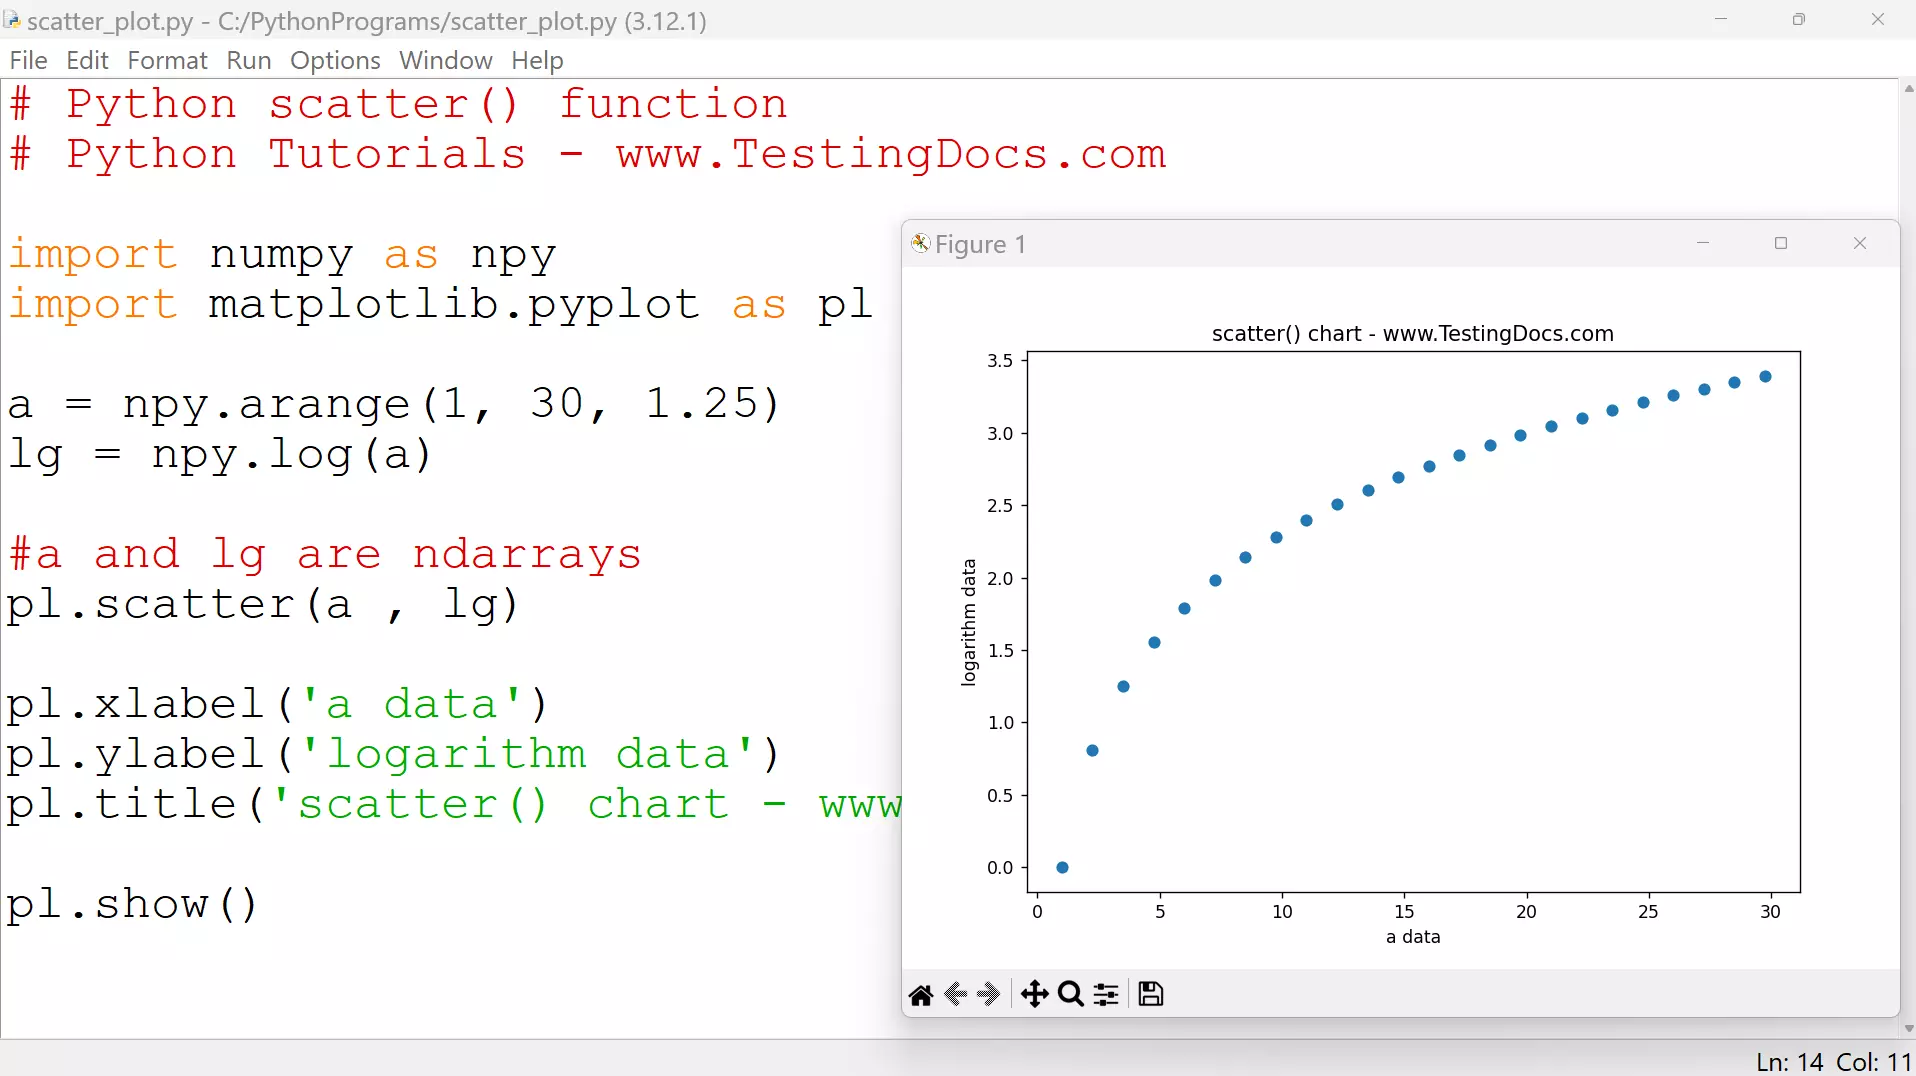
a = npy.arange(1, 30, 1.25)
lg = npy.log(a)
pl.scatter(a , lg)
pl.xlabel(‘a data’)
pl.ylabel(‘logarithm data’)
pl.title(‘scatter() chart – www.TestingDocs.com’)
pl.show()
Python Tutorials
Python Tutorial on this website can be found at: