
Blog
Python plot() function

Python plot() function
In this tutorial, we will understand the Python plot() function. The PyPlot interface offers the plot() function for creating 2D graphs and plots.
The Matplotlib Library has a simple interface for creating basic 2D plots using the plot() function. This includes line plots, scatter plots, bar plots, and more, which can be created using the Pyplot module.
plot() Syntax
The general syntax of the function is as follows:
pl.plot(x , y)
pl is the alias for the module imported using the statement:
import matplotlib.pyplot as pl
Line style
We can also specify the plot line style:
<matplotlib>.plot(<xdata>, <ydata> , <linestyle>)
linestyle or ls = [âSolidâ | âdashedâ , âdashdotâ , âdottedâ]
Marker Type
The plot( ) function accepts arguments to change marker type, size, and color.
marker = <valid marker type> , markersize = <in points> , markeredgecolor = <valid color>
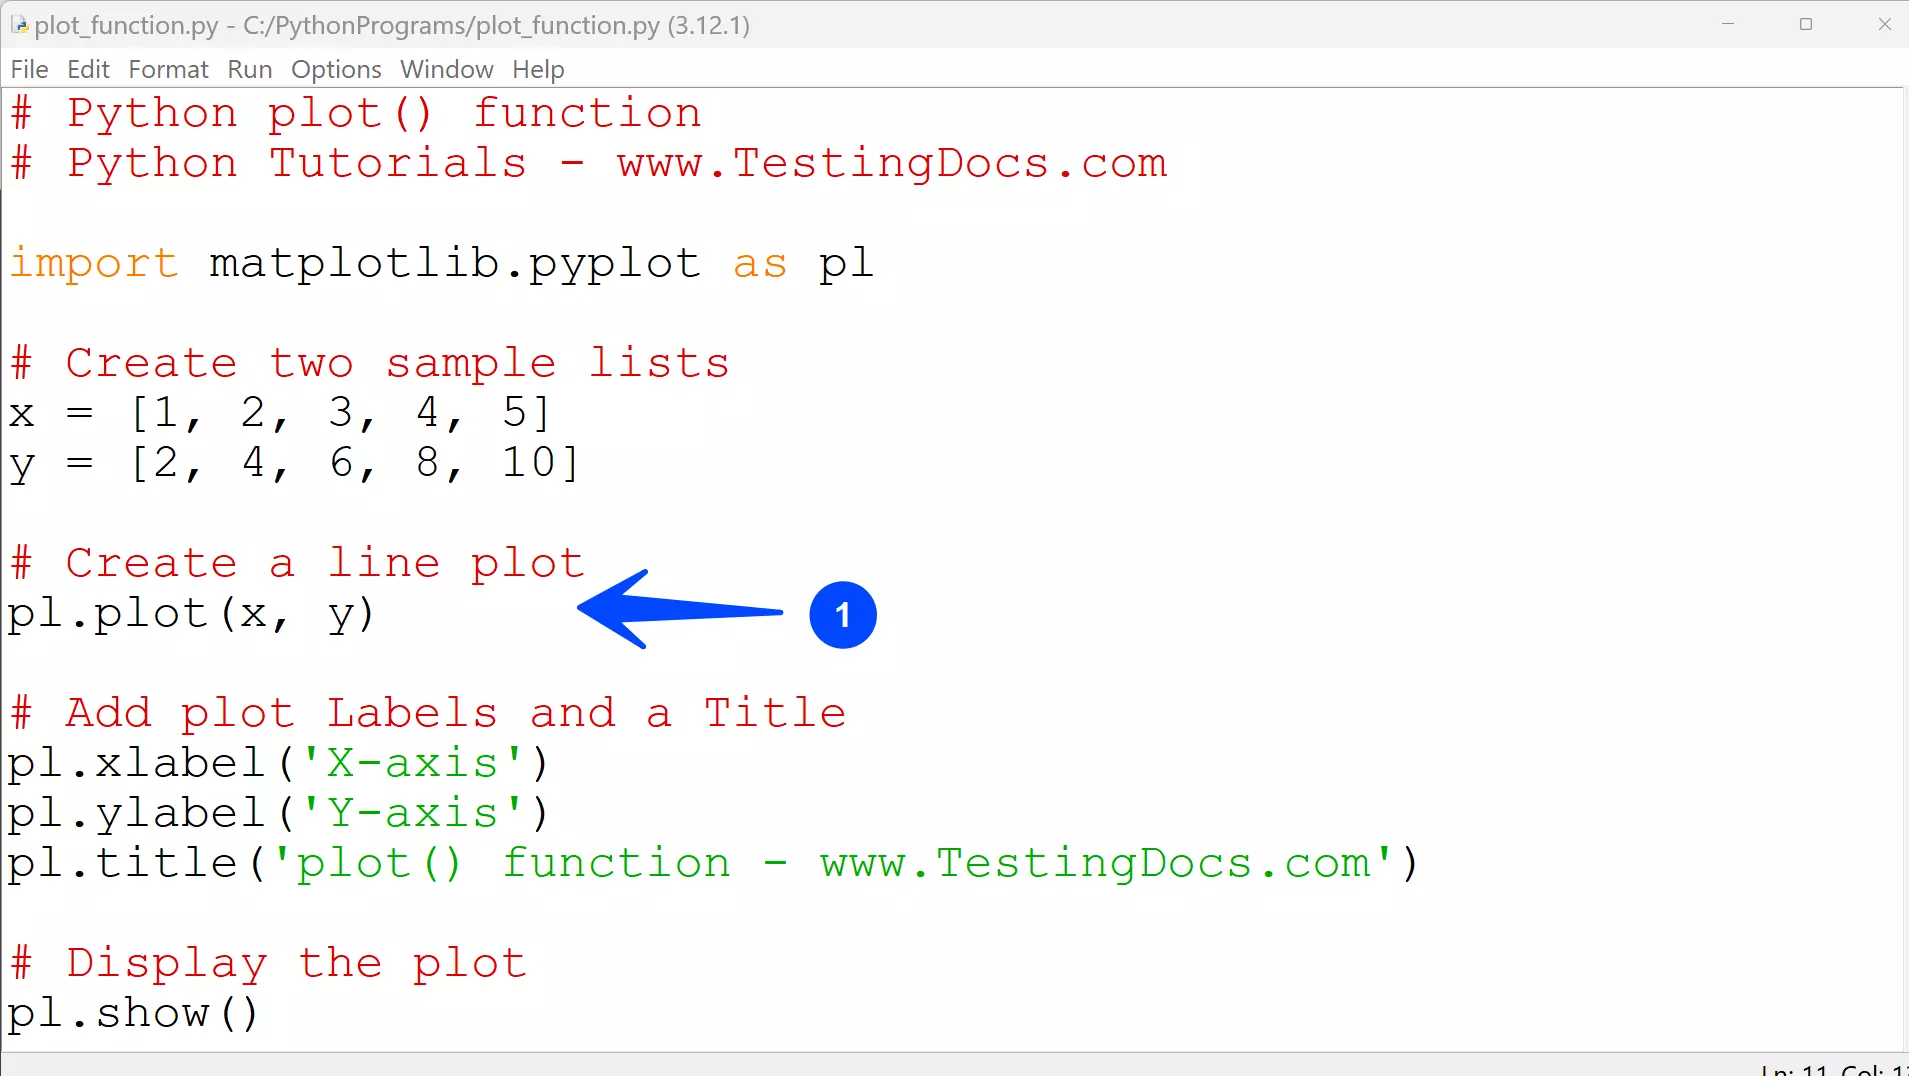
Python plot() example
# Python plot() function
# Python Tutorials – www.TestingDocs.com
import matplotlib.pyplot as pl
# Create two sample lists
x = [1, 2, 3, 4, 5]
y = [2, 4, 6, 8, 10]
# Create a line plot
pl.plot(x, y)
# Add plot Labels and a Title
pl.xlabel(‘X-axis’)
pl.ylabel(‘Y-axis’)
pl.title(‘plot() function – www.TestingDocs.com’)
# Display the plot
pl.show()
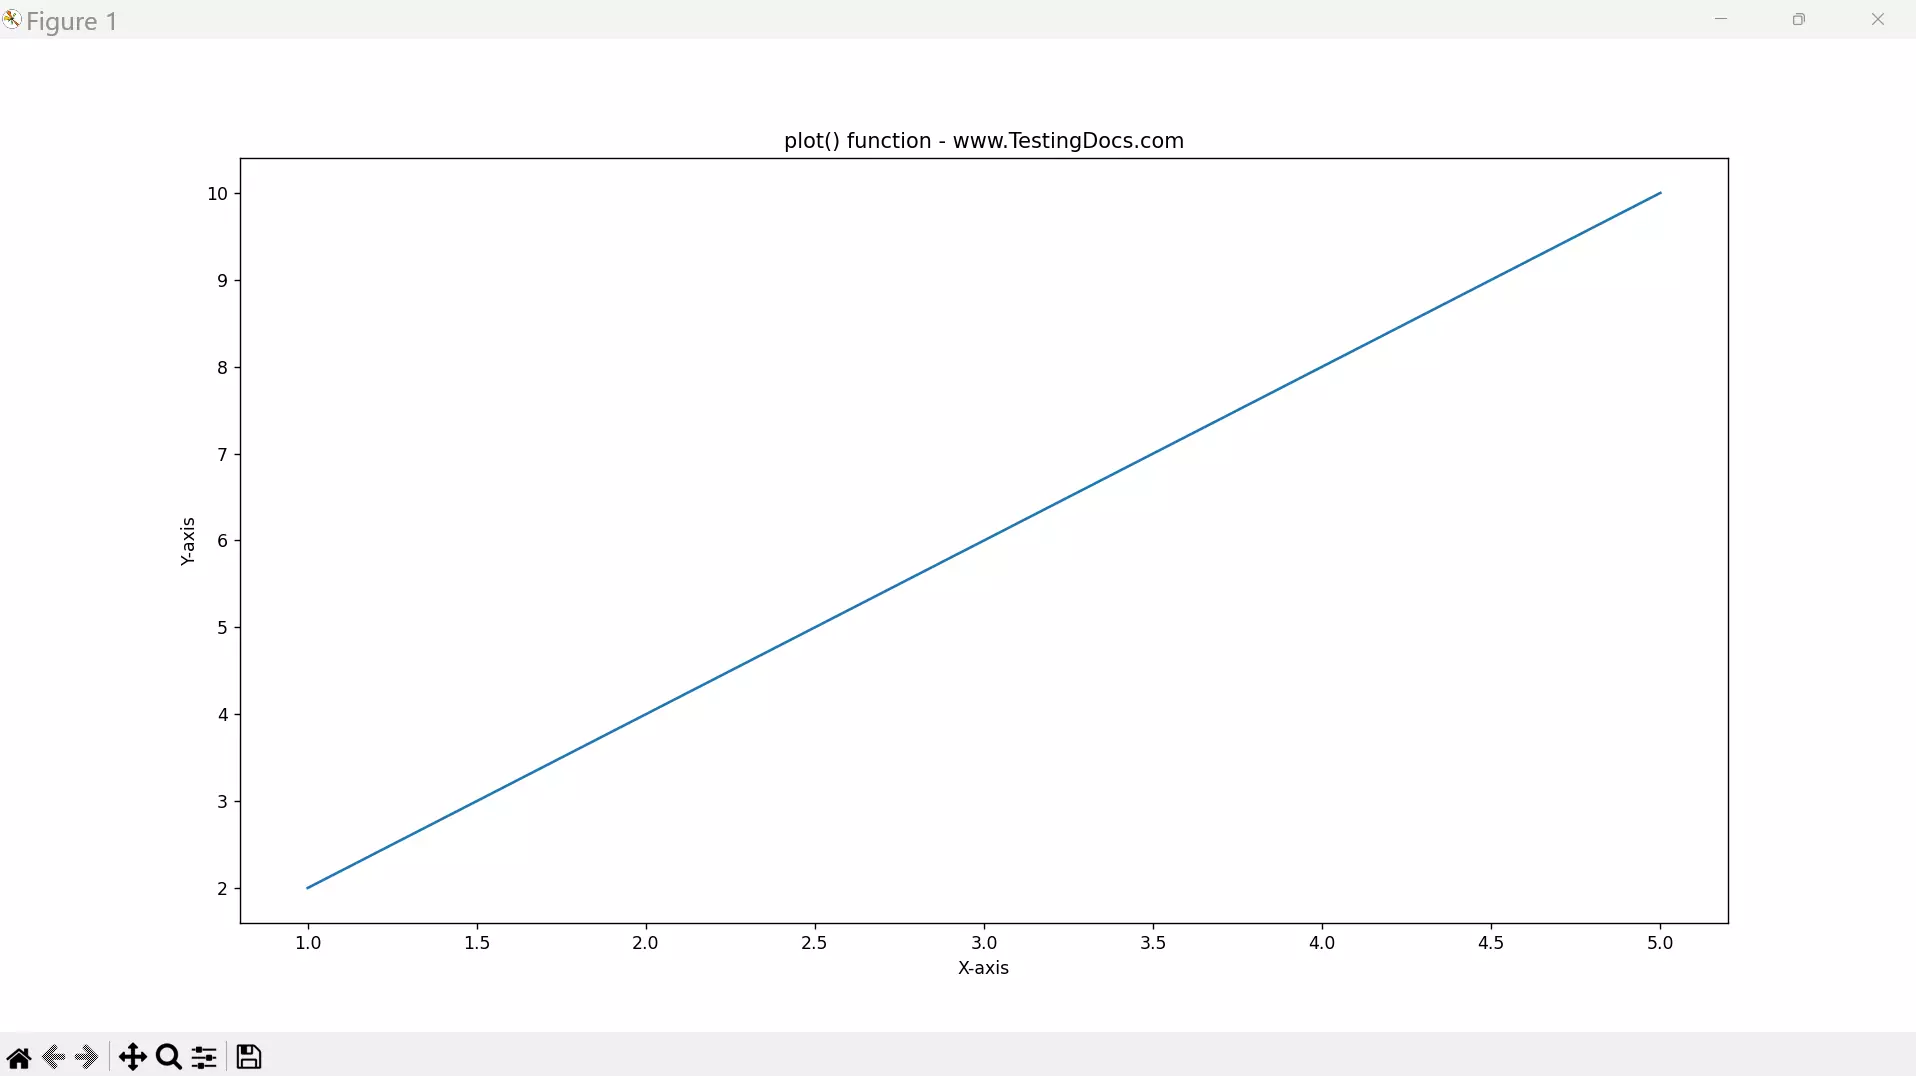
Program Output
—
Python Tutorials
Python Tutorial on this website can be found at: